
Transport planning and simulation
Data you won't find elsewhere.
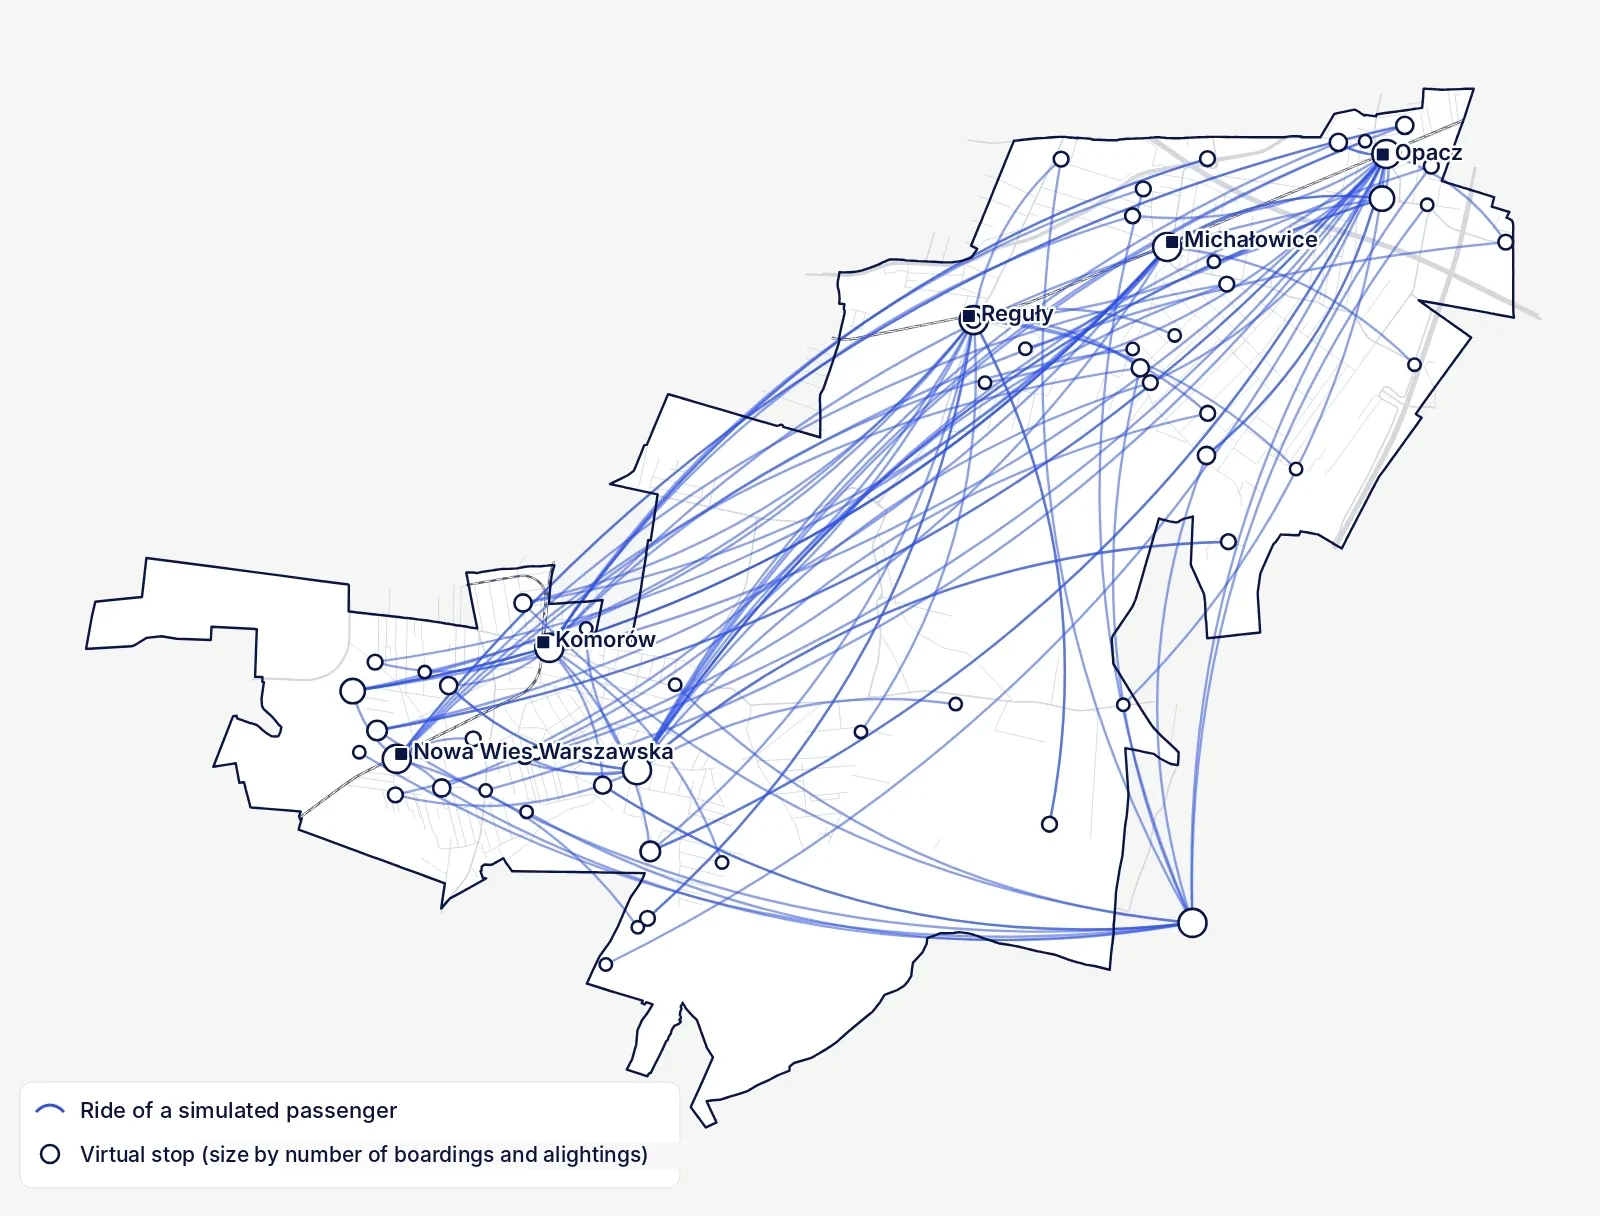
Every study rests on three sources. Data from our own DRT operations shows how people actually behave when they book rides.
Five years of operational data
Bookings, rides, waiting times and vehicle occupancy from towns, villages and regions where DRT runs on CITYA. We know how the service behaves in a town, in the suburbs and in a sparsely populated region.Data we buy
We buy traffic flow data from third parties: where, when and from where people drive between municipalities and neighbourhoods, on weekdays and at weekends. We add geodemographic segmentation of residents.Public data
Census and commuting data, population density, GTFS timetables, OpenStreetMap and points of interest: schools, healthcare, public offices, shops and stations.
Transport planning for DRT
- Population distribution, points of interest and major employers
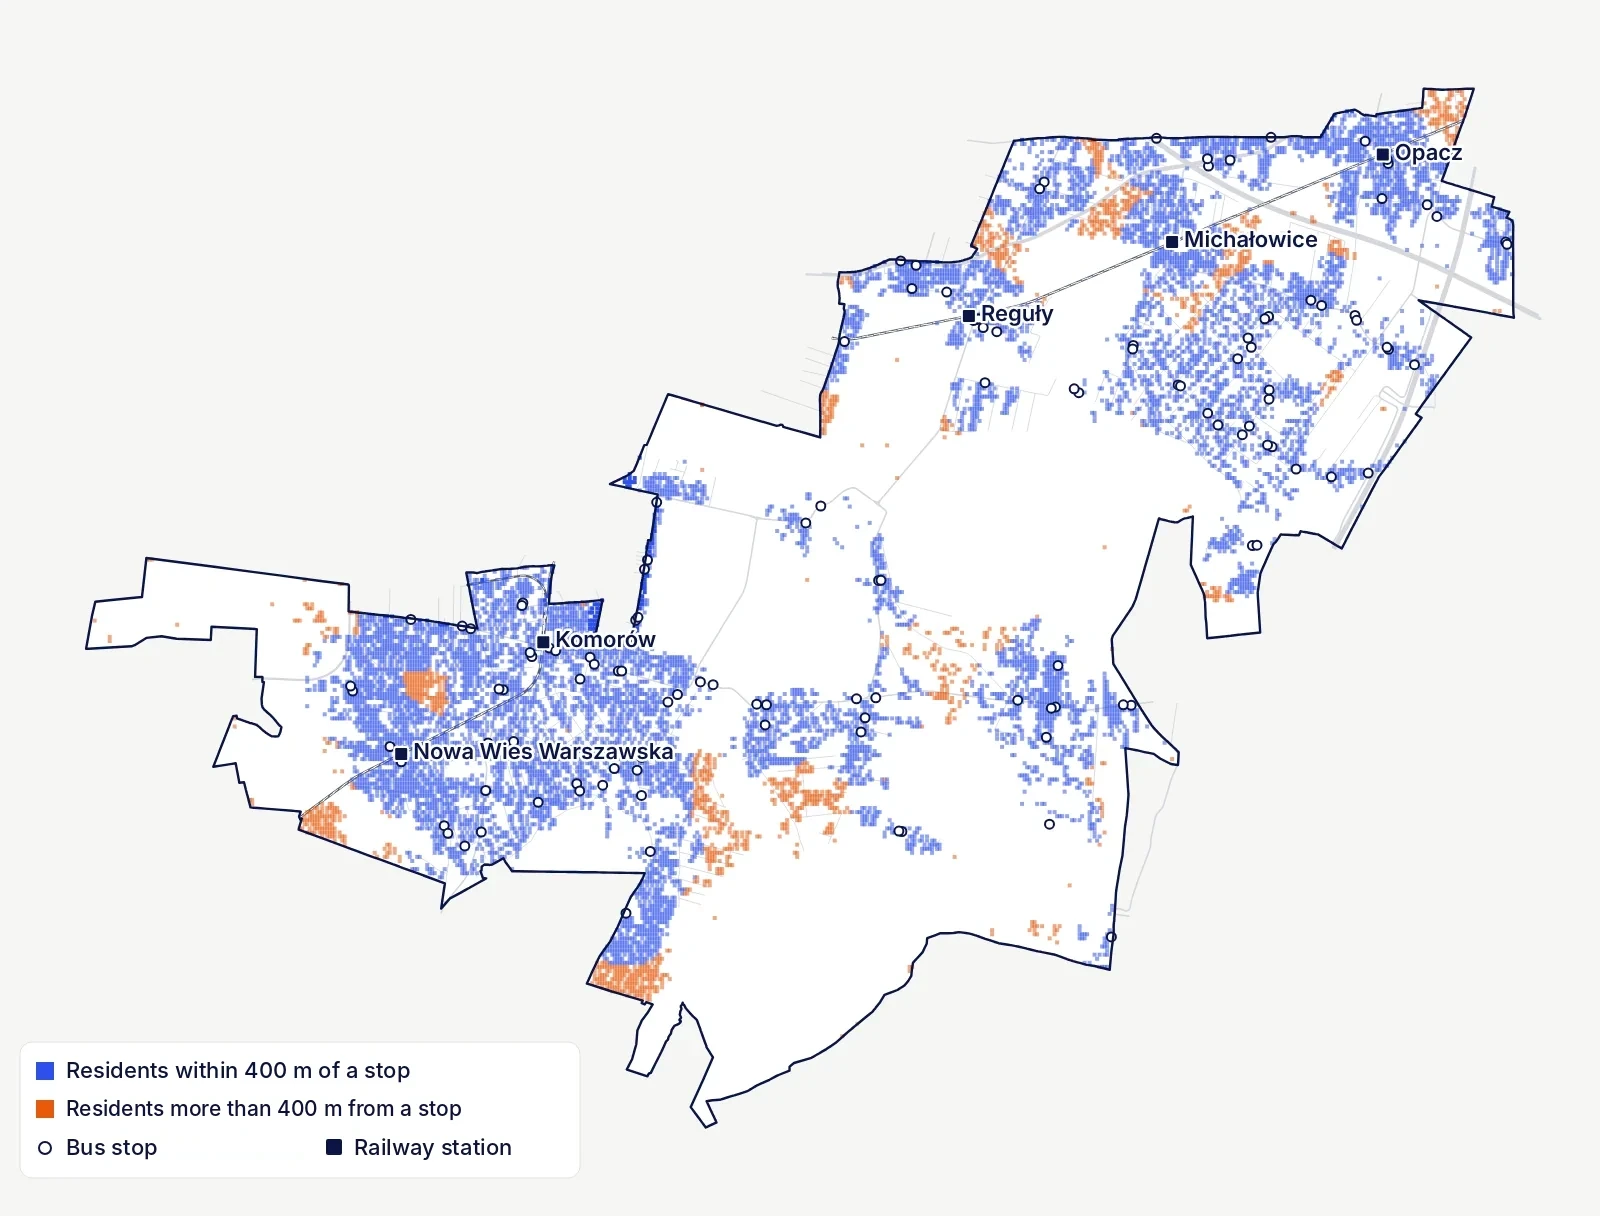
- Walking distance to stops and gaps in coverage
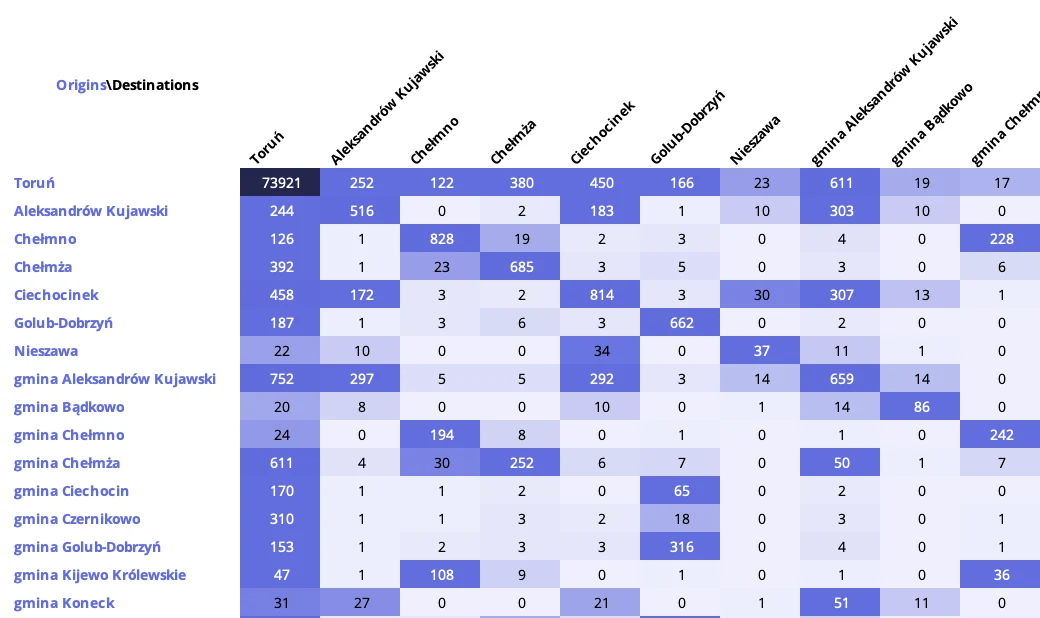
- Catchment areas and main travel directions, origin–destination matrices
- Modal split between car and public transport
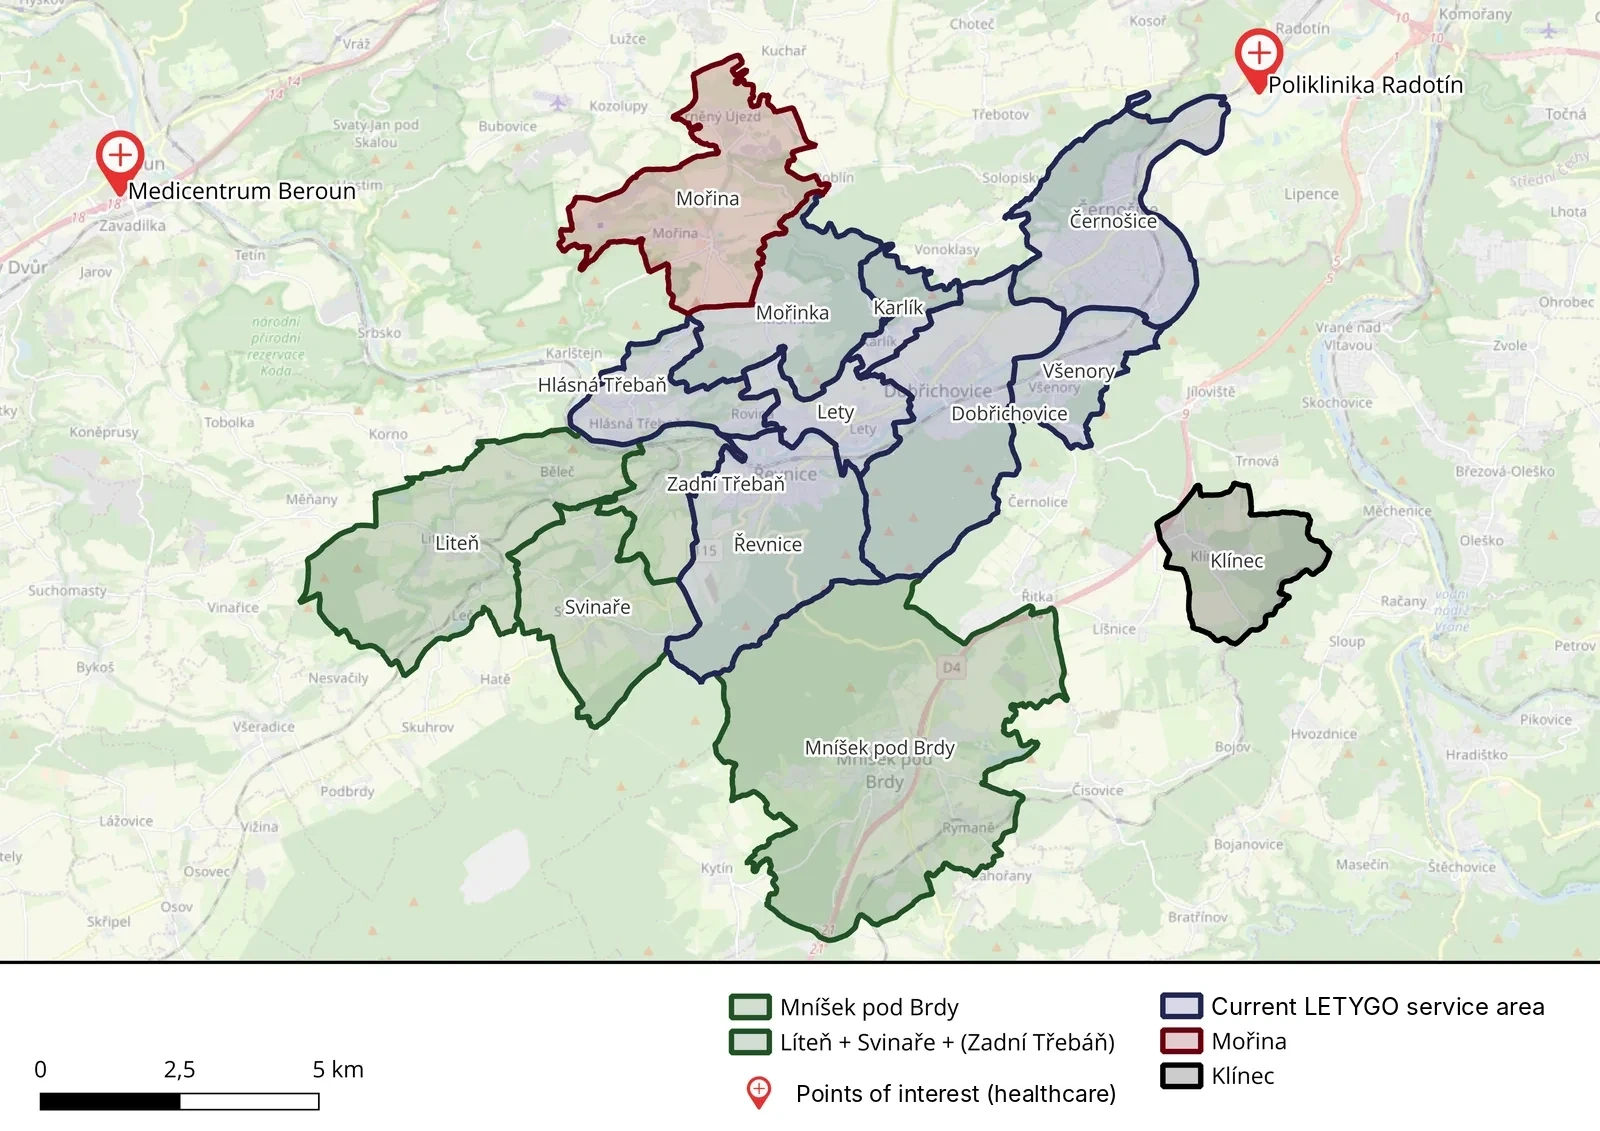
- Service area, virtual stops and interchanges
- Operating concept: rides across the whole area, feeder to an interchange, or fixed journeys at peak times
Service design and development
Simulation before launch
Before the service starts, you know how many vehicles it needs, how long people will wait and what it will cost. The simulation runs on the CITYA allocator, which then runs live operations.
- Synthetic demand from the analysis: where, from where and when people will travel
- Dozens of experiments, from one vehicle to the optimum for the area
- Pick-up wait, journey time and delay against plan
- Budget model: rides, costs and revenue per day and per month
| Vehicles \ demand | Low | Medium | Higher | High |
|---|---|---|---|---|
| 1 vehicle | 12 | 11 | 23 | 59 |
| 2 vehicles | 9 | 11 | 12 | 13 |
| 3 vehicles | 8 | 11 | 9 | 11 |
| 4 vehicles | 7 | 8 | 11 | 10 |
Simulation for gmina Michałowice (PL), two runs for each combination of fleet size and synthetic demand. One vehicle is enough only at low demand. With two vehicles the median wait stays within 13 minutes even at the highest demand tested.
Analyses for regions and transport authorities
For authorities running integrated networks, such as KORDIS JMK or Doprava Ústeckého kraje in the Czech Republic, we analyse the whole region. We show where DRT has the greatest potential, which underused journeys it can replace, and how to bring it into the fares, timetables, the region's app and journey planners.
Our process
Data
We combine operational data, purchased data and public sources.
Analysis
We find out where people live, where they travel and where services are missing.
Design
We design the area, stops, operating hours and connections.
Simulation
We test the design on the allocator and work out the vehicles and the budget.
Pilot
The service starts, we measure results and fine-tune it on data.
What you get.
Analysis
Current service levels, accessibility and residents' mobility in the region.
Design
Service area, virtual stops, interchanges, operating hours and connections to bus routes and rail.
Simulation and budget
Results of the simulation experiments, the recommended number of vehicles and a budget model for operations.
Implementation
Integration with fares, the app and journey planners, the legal framework and a pilot plan.
Supporting papers
For councils, regional boards and operator procurement. We deliver studies in Czech, Polish and English.
Where we have prepared studies.
Studies have turned into services that run today. In Liberec, for example, DRT connected an outlying neighbourhood to the city's public transport and rail.
Regions
- Ústí nad Labem Region
- Liberec Region
- Olomouc Region
Towns and cities
- Plzeň
- Liberec
- Hradec Králové
- Most
- Hodonín
- Uherské Hradiště
- Litoměřice
- Šumperk
- Krnov
- Český Krumlov
- Moravská Třebová
- Pelhřimov
- Benešov
- Chodov
- Roudnice nad Labem
- Vsetín
- Bystřice
- Štětí
- Modřice
- Kamenice
- Úštěk
Micro-regions and villages
- Osoblažsko
- MAS Opavsko
- Voticko
- Rožnovsko
- Lety
- Pyšely
- Chocerady
- Klánovice a Újezd nad Lesy
Outside the Czech Republic
- Michałowice (PL)
- Siechnice (PL)
- Kobierzyce (PL)
- Wałbrzych (PL)
- Toruń (PL)
- Trnava (SK)
- El Paso (USA)
Frequently asked questions
We'll show you how DRT would run in your area.
An hour of your time, your data, no commitment.
Book a consultation